Lately, I’ve been exploring music production — but with a bit of a twist. I’ve been using Suno to generate full songs with AI, then treating those tracks as creative templates. The goal isn’t to rely on AI to make music for me, but to use it as a springboard for learning and experimentation. These AI-generated songs give me something to respond to, reverse-engineer, and rebuild — helping me rapidly dive into different areas of production, from sound design to mixing.
For those curious about what AI music already sounds like, I’ve posted a few examples on my YouTube channel — not as polished final tracks, but as snapshots of what these tools can already produce.
Recreating the songs from scratch has turned into a rewarding technical and creative challenge. I find myself jumping between drum sample design, recording live bass guitar, recreating synth leads with Serum 2, and pulling it all together in Ableton Live or Bitwig — with the mixing and production process becoming one of the most fascinating parts for me.
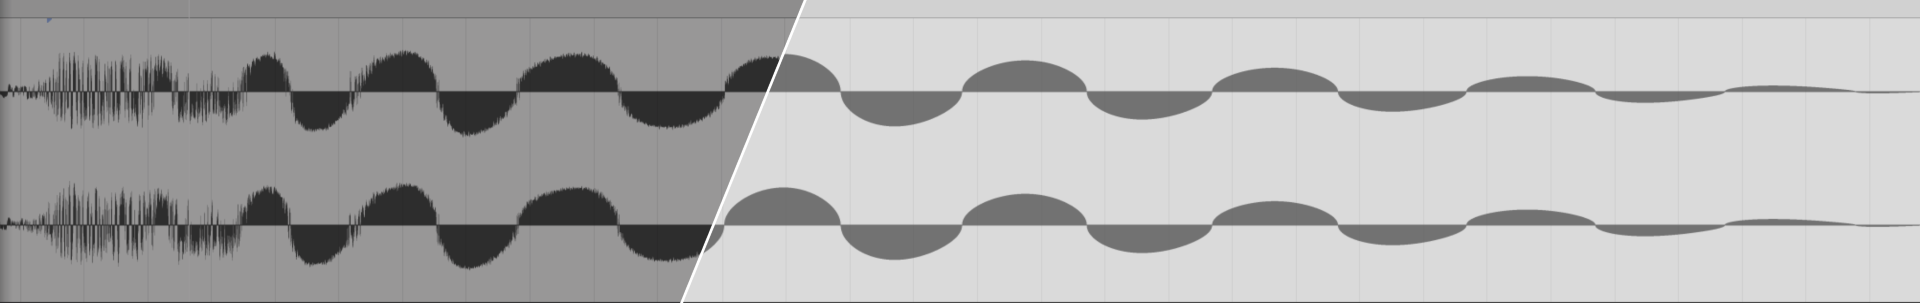
This hands-on process has quickly exposed gaps in my toolkit and knowledge. Most recently: I needed a spectrogram to properly visualise the transient shapes and frequency content of kick drums I was recreating.
I could’ve just used an off-the-shelf plugin — but I’ve always wanted to understand how FFTs work, and I enjoy using side projects to learn something fundamental. So I built a Haskell CLI tool over a weekend that:
Accepts a PCM audio file (like WAV or FLAC),
Runs overlapping FFT windows over the signal,
Outputs a simple spectrogram image for analysis.
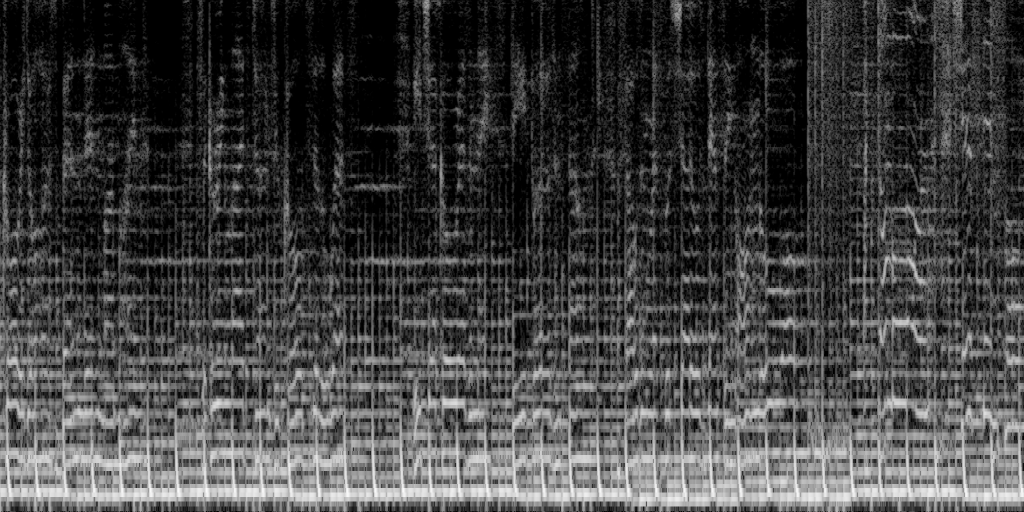
It’s still early days, but building it taught me a lot about how window functions and overlap affect the time/frequency tradeoff — especially when dealing with low-end content in the sub-100Hz range. That area has proven particularly tricky to visualise clearly, and it’s pushed me to explore ways to sharpen the spectrogram output.
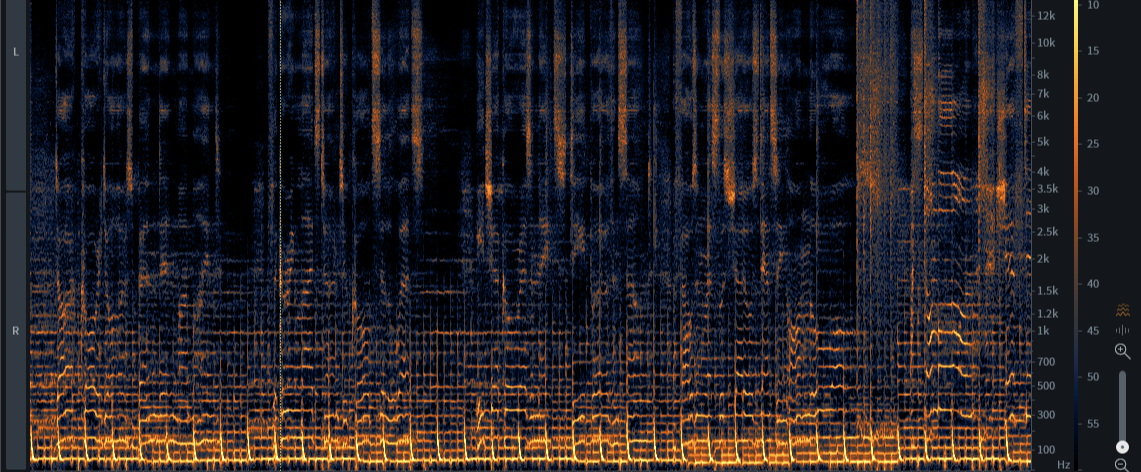
I’ve started refactoring the code to be more modular and composable (eating my own dog food there), to make it easy to swap in different window functions or FFT implementations. The plan is to explore the reassignment method for sharpening the spectrogram, and to look into multi-resolution techniques like the Constant-Q Transform to better represent low-frequency content.
For reference, this is iZotope’s RX 11 spectrogram using multi-resolution and reassignment:
It also reaffirmed one of my favourite ideas in tech: sometimes the best learning comes from chasing your curiosity sideways. Music production gave me the need, Haskell gave me the clarity, and now I’ve got a tool that fits into both worlds.
Next steps: real-time display, db scaling, and maybe publishing the library as a learning resource. I plan to release the code on GitHub as soon as it’s ready — hopefully alongside a follow-up blog post exploring the new techniques.